TackAnalyst.com
Racing Upwind
The typical first leg of every racecourse for sailboats is an upwind segment. Ironically, a sailboat cannot travel directly upwind.
Sailboats are limited in this ability and cannot sail any higher than a certain angle towards the wind. At this point of sail, the boat is said to be “close-hauled” or "beating to windward.”
Sails are shaped to produce lift, like airplane wings. But they are not rigid. When the wind hits them directly from the front, they flap and lose shape, causing a loss of forward motion. This is known as “luffing”. The boat essentially stalls and cannot move forward.
Traveling directly upwind can only be accomplished by “tacking.”
Tacking or “coming about” is a sailing maneuver by which a sailboat, sailing close-hauled, turns its bow toward and through the wind. As the boat turns, the wind’s direction shifts from one side to the other relative to the boat.
To travel towards a windward destination, a craft must perform a series of tacking maneuvers in that direction. Each resultant course is a "tack.” The tack having the wind over the right-hand side of the boat as the skipper looks forward is called a “starboard” tack. The opposite tack is called a “port” tack.
The diagram below shows three courses: P1, P2, and P3. These are a series of port and starboard tacks with the boat beating from A to B. The distance sailed on each of these courses is precisely the same. However, P3 requires only one tacking maneuver, while P1 requires 5.
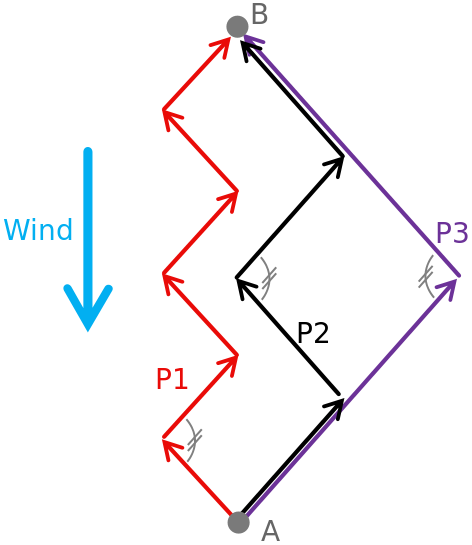
Since the distance sailed is identical, and each maneuver causes a slowing of the boat due to luffing, there always needs to be a reason to tack. If there is no reason to tack, don’t tack. Many racers tack too often.
Knowing when and how to tack a sailboat efficiently is crucial for winning races.
Improve Your Tacking Skills
Given an equal start and equal boat speed, why does one sailer “out-tack” another to be first at the windward mark?
The answer lies in examining the physical elements that make up a tack.
The predominant elements are the entry speed, the deceleration of the boat as it begins to rotate toward the wind, the rotational speed as it comes about, the speed lost, the acceleration out of the tack, the exit heading, and the overall tack angle.
Entry Speed: Maximizing entry speed will increase the average speed through the early portion of the tack.
Deceleration: As the boat turns into the wind, its speed decreases as the sails become loose and start flapping. Sailors refer to the distance made good towards the windward mark interns of speed. A boat with a faster speed in the windward direction travels further in the same amount of time. The speed in the windward direction is known as “Velocity Made Good,” or VMG. To achieve a higher VMG, it is essential to maintain speed for as long as possible.
Rotational speed: As the boat rotates, it changes heading from the old to the new. The boat’s rotational speed should begin slowly, gradually increasing to reach a maximum before falling off as the new heading is reached. Avoid using a jerky “studder rudder” as it will act as a brake and slow down the boat.
Speed Lost: This is the difference between the entry and minimum speeds during the tack. When the difference is expressed as a percentage, higher losses indicate a need for improvement.
Acceleration: As the boat is coming about, the sails have no power. The boat reaches the minimum speed at the end of the tack. After it reaches a proper exit heading, its sails fill, and it accelerates. The objective is to swiftly maximize acceleration to reach an exit speed equal to the entry speed.
Exit heading: Coming out of the tack, the exit heading places the boat on a close-hauled course. If the boat is too close to the wind, it is said to be “pinching” and will have a reduced speed as it travels in a windward direction. If the boat is off the wind, it is said to be “footing” and will have a higher speed but make less progress windward. Some coaches recommend footing on exiting and then rotating the boat toward the wind after it regains full speed.
Overall tack angle: The overall tack angle is the difference between the before-tack and after-tack headings. The angle changes with wind conditions, boat design, sail design, rigging set-up, and tacking skills. Generally, it is about 90 deg. Assuming the same boat speed, a smaller angle results in greater windward progress.
This website offers tools to assess tacking techniques in terms of the physical elements described above. Having feedback enables the sailor to judge their effectiveness.
To improve your tacking skills, follow a cycle of practicing and feedback. This website is designed to provide feedback.
Review the “Instructions for use” tab, then try running the demo file in the “File Manager” tab.
Why Tackanalyst?
This website can evaluate racing sailors’ tacking skills as they learn techniques for making a good tack from instructors, coaches, or other sources. This site provides the tools to evaluate the sailing results and provide feedback to reinforce improvement.
Feedback is provided by recording sailing activities such as practices and races, importing the data into this website, and using the tools provided to evaluate performance.
The imported data is in standard GPX (GPS Exchange Format) files. They contain latitude, longitude, and time data on location points. The data is recorded by wearing a GPS device such as a Garmin fitness watch while sailing.
Garmin watches can be set up to record GPS data at 1-second intervals. Users then upload the data to the “Garmin Connect” website (URL: https://sso.garmin.com/portal/sso/en-US/sign-in?clientId=GarminConnect&service=https://connect.garmin.com/modern/badges). The watch file is then downloaded as a GPX file.
After downloading the GPX file, it is uploaded to this website. Headings, speeds, distances, and other variables are calculated and displayed for further interpretation and analysis.
Legs & Tacks Report:
Selected Points Table
Measurements at each point:
Row: sec.... lat & lon: deg....dist.to.prev: ft.... Speed: Knots.... Accel:ft/sec/sec.... Rotation_sp: deg/sec.... Heading: deg
Tacks Table
Legs Table
Measurements are over each Leg
Maps of Selected Tacks:
Maps of Selected Tacks:
Location:
Instructions
TackAnalyst is an educational website with interactive tools to help sailors improve their tacking techniques.
TackAnalyst uses tracking information in files recorded on fitness watches such as the Garmin brand. Speed, headings, and other performance characteristics are recorded. They are GPS data tables of position or location measured in latitude, longitude, and date, including time of day. The default setup on a Garmin watch is to record data in 3-second intervals. This needs to be changed to record rows of data at 1-second intervals. The raw data is uploaded to the “Garmin Connect Site.” Then, a GPX file is downloaded from the Garmin connect page and loaded onto TackAnalyst for analysis. After loading the GPX file for a given event, TackAnalyst calculates speed, headings, and other performance characteristics from the information and presents the results in tables and graphs, allowing users to examine and review their sailing performance. The GPX file or any portion can be downloaded as a CSV file for later use.
TackAnalyst opens with seven tabs at the top of the page. These are “Intro to Tackanalyst,” “File Manager,” “Create Reports,” “Tack Maps,” “Tack Analysis,” “Location Map,” and “Instructions for Use.”
Intro to Tackanalyst
The website’s homepage explains sailing terminology and techniques for tacking sailboats.
File Manager:
Here, GPX or CSV files are used as inputs to Tackanalyst. Sections of the input files are selected for display and further review and analysis.
CSV Input: If checked, the input file is CSV; otherwise, it is GPX
Erase Data: Erases current data file
Run Tutorial File: Loads a sample file for practice
Select Range To Plot: choose a time segment to plot. Time is measured in seconds.
Note: The tutorial data starts at row 700 since the watch used to record the event started 700 seconds before the race began. The data file spans 840 seconds, so the final row in the table is 1540.
Plot the File: Plots the selected segment.
Note: Hovering above each scatter point annotates the point with the sailing data at that location. Clicking on the point will label it with its row number, time, heading, speed in knots, and acceleration in ft/sec/sec. To remove the point labels, press “Plot the File. ” The chart will be replotted without the tags.
Mode Bar: Additional menu above the colored speed index.
Camera: Download the Plot as a PNG
+ Sign: zoom in
- Sign: zoom out
House: resets axis
Note: Moving the cursor to the X and Y axis exposes a double arrow. Dragging along either axis pans the chart.
Create Reports:
The course plotted in the file manager main panel is replotted in the upper portion of the “Create Reports” page. Below the plotted course are three tables. These are the “Selected Points Table,” “Tacks Table’” and “Legs Table” and selection boxes to create them.
Download Selected Points Table Data: Download selected points as a CSV file.
Download Chart Data File: Downloads the plotted segment, not the whole file, as a CSV file.
Re-Plot: Replots data to clear the Point labels
Selected Points Table: This table shows the row number of any clicked point and some preliminary information about that point.
Tacks Table: This table shows the row number of the selected points, assuming they are tacks.
Create Tacks Report: Creates the tack analysis.
Create Tack Maps: The tacks are charted on the Tack Maps page.
Clear Tacks Report: This erases the tacks report.
Download Tack Table: Download Tack Table Data as a CSV file.
Legs Table: This table shows a pair of selected points defining a “straight “ section with some information about the segment.
Create Legs Report: Creates the Legs Report.
Clear Legs Report: Erases the Legs Report
Download Legs Table: Download Legs Table Data as a CSV file.
Tack Maps:
The tack maps page can display ten tacks created by “Create Tack Maps” on the “Create Reports“ page. The X and Y variables can be selected by clicking the down arrow and selecting from the available choices. The default is longitude vs latitude.
Clear Maps: Erases all the maps on this page.
Tack Number: Displays the row number of the center of the selected tack.
X: The label of the X coordinate of the plot
Y: The label of the Y coordinate of the plot.
The X and Y coordinates are:
Lon: Longitude in degrees
Lat: Latitude in degrees
Row: The GPX data row in seconds after the start. Measurements in the GPX data file are taken every second.
Heading: True heading in degrees.
Knots: speed in Knots
Accel: Acceleration in feet/second/second
Rotational_sp: Rate at which the boat is rotating as it turns in degrees/second
Tack Analysis:
The analysis page shows four different graphs of a particular selected tack. Speed in knots, acceleration in ft/sec/sec, heading in degrees, and rotational speed in degrees per second are plotted against the row number or time in seconds. The table displays wind direction in degrees, velocity made good (VMG) in knots, distance made good in feet (DMG), DMG as a percentage of total distance traveled, and variables taken from the tack map screen.
Location Map:
The plotted chart positions on a geographic/street map.